The first process mining tool with essential features for Microsoft

With BIpm, we enable the Microsoft Power BI users to employ essential process mining functions.
As also stated by Professor Wil van der Aalst, it was the first official custom visual adding process mining capabilities to the Microsoft Power BI. BIpm gives you the free experience of process mining with no lucked function. You will be able to analyse any part of your process model using its interactive interface. Sitting on the top of Microsoft Power BI, you can integrate lots of other tools and software with it, thanks to the excellent Microsoft platform.
Our custom visual generates an interactive directed flow graph, helping users to understand better their complex process model, based on the loaded event log dataset.
INTEGRATED PROCESS MINING
BIpm
BIpm gives you the opportunity to enjoy the advantages of process mining within the Microsoft Power BI
The first one
The first worldwide process mining custom visual for Microsoft Power BI
FREE OF CHARGE
A completely free experience of process mining with no locked feature or function
INTERACTIVE
With an interactive interface to freely analyse any segment of your process chain
INTEGRATED
Compatible with other Microsoft products, thanks to Microsoft Power BI
Interactivity
Interactivity is one of the main features of BIpm. Unlike other process mining visuals, BIpm is not only an image of the generated process model. It is an interactive graph, in which you can make changes. It gives you the full freedom of bringing the displayed process model in the way you need, and you like.
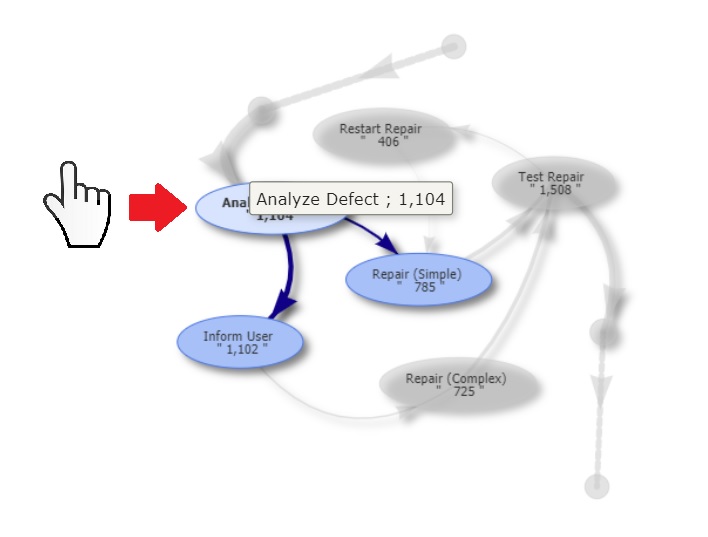
Selecting activity-related process
On the visual output graph, when your mouse hovers each activity node, the process model is automatically filtered, and only related activities with a first-level depth are then enabled. Activities with second-level depth become transparent, and others are faded.
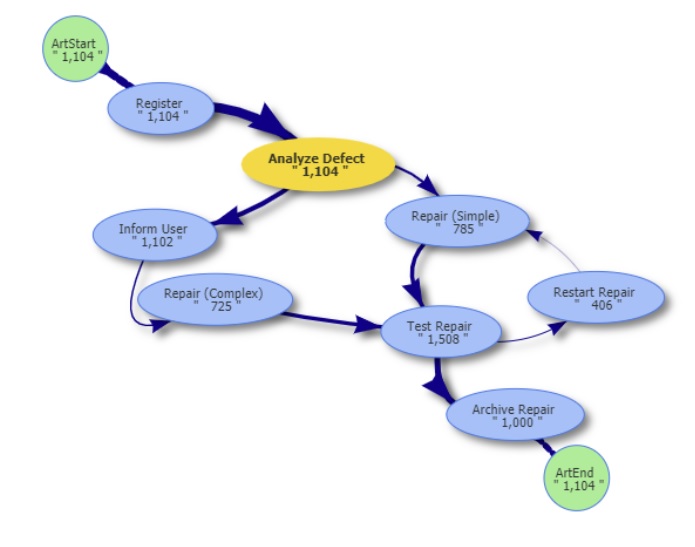
Highlighting nodes
By clicking on each node, its colour changes to yellow to emphasis on it, if needed.
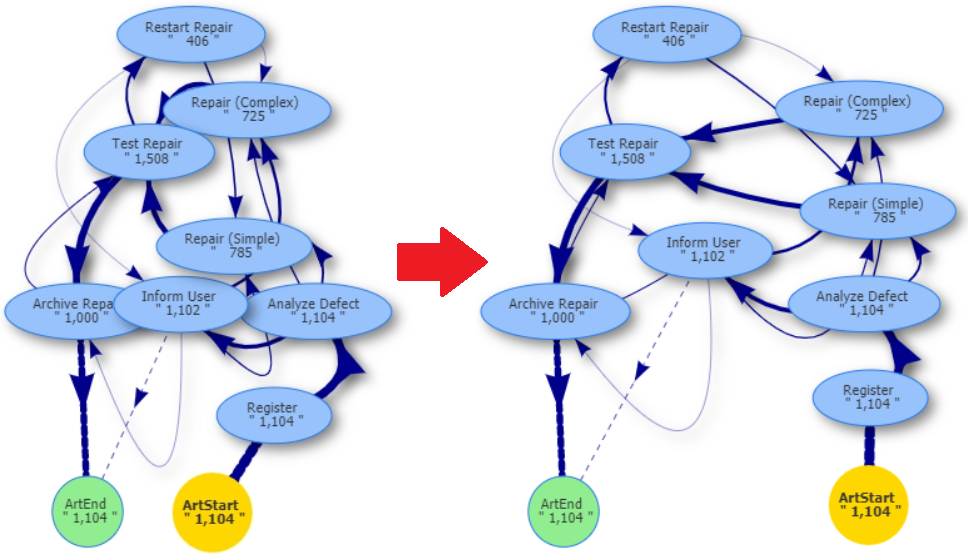
Changing the process layout
By dragging the nodes, you can change the layout of the generated process model. It helps, for example, when a particular part of the process model should be analysed more detailed, or if you don’t prefer the predefined layouts.
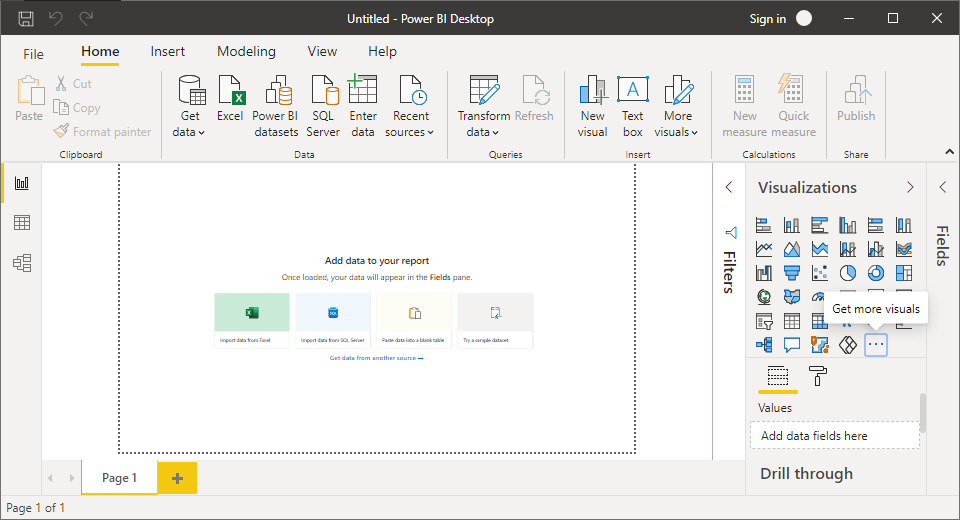
How to install BIpm
Before using BIpm, the following steps should be done.
I. Download and install the latest R distribution.
II. Enable R visuals in Power BI.
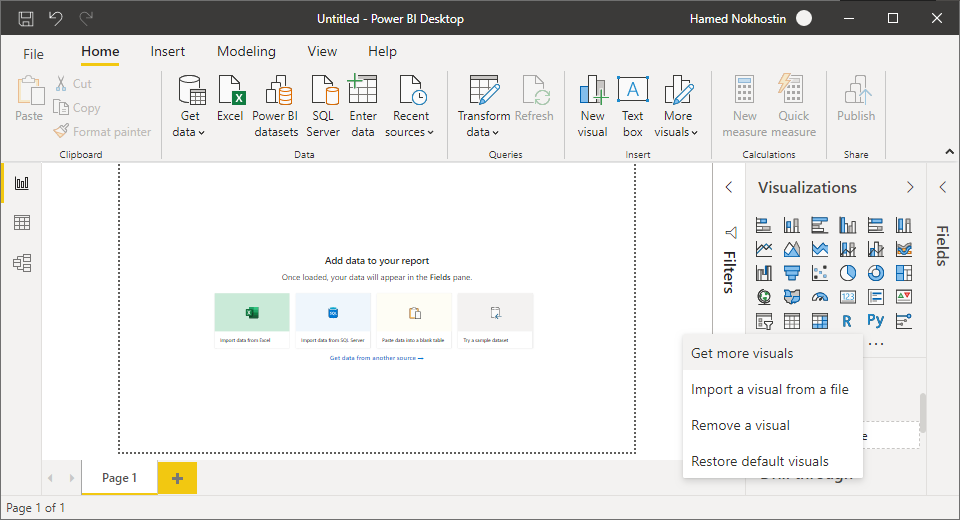
III. From here, there are two ways to add BIpm to Power BI:
a-1. Download the BIpm installation file (file format: .pbiviz).
a-2. Import the downloaded installation file in Power BI.
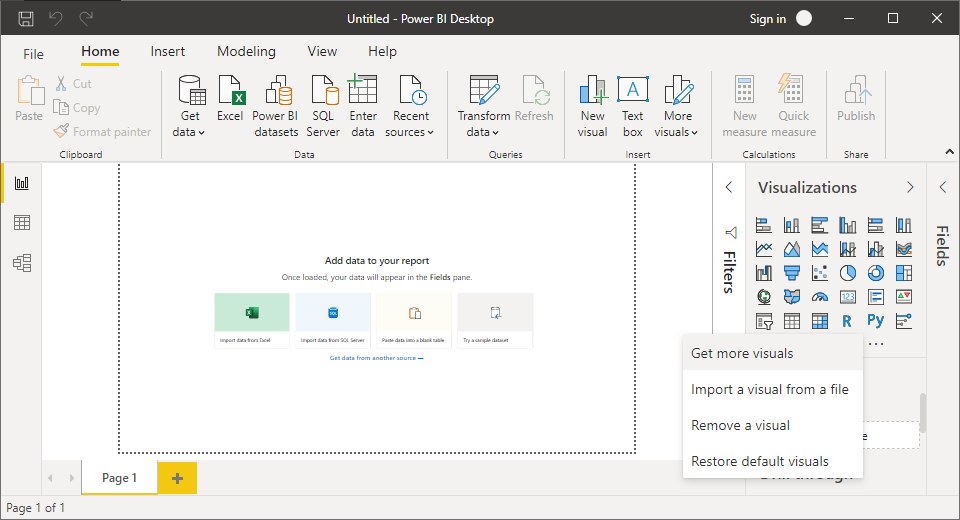

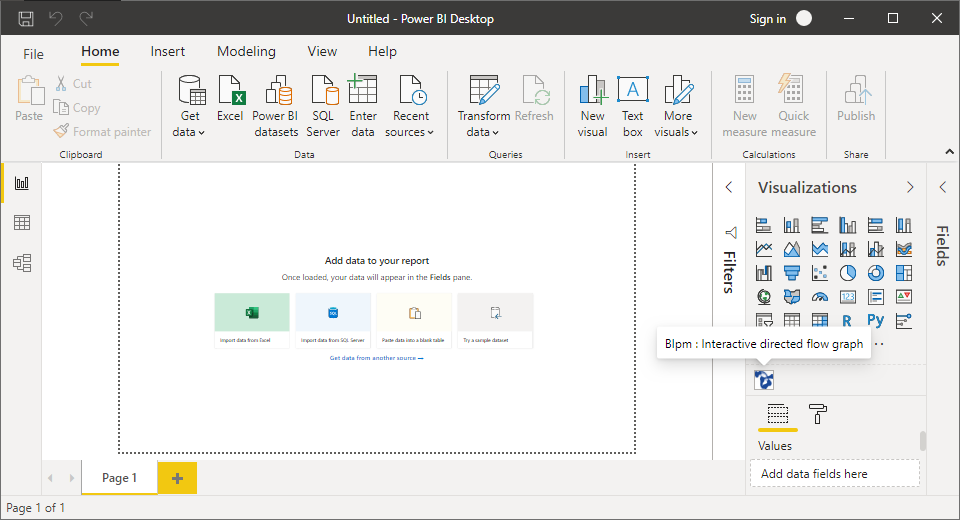
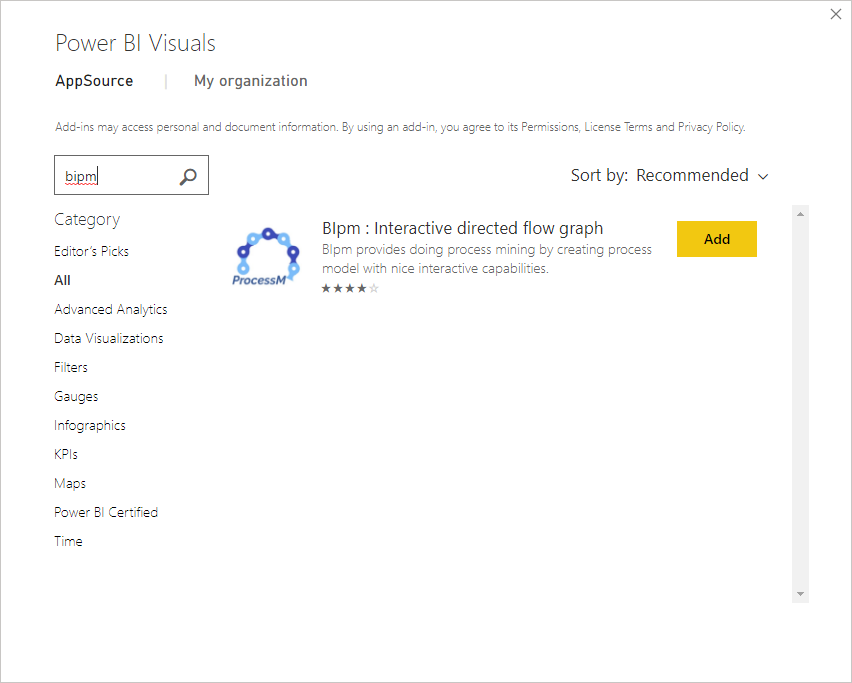
b. Add the BIpm to Power BI, without downloading the installation file.
Almost there…
Before starting to enjoy the process mining with BIpm, make sure that your data set has the following attributes of an event log:
Case ID
This field is mandatory, and according to the process mining literature, it is a unique value for all executed activities relating to a particular object like a case, customer, product or offer. The data type of this field should be numeric.
Activity
This is another mandatory field according to the process mining literature; it is related to the name of activities participating in the process.
Timestamp
This field is also mandatory. According to the process mining literature, it records the execution time of a specific activity related to a particular case. The data type of this field can be numeric or timestamp. Notably, any ordering of integer value such series is also acceptable.
Be careful!
Case ID, Activity, and Timestamp should be typically set as “Don’t summarize” to be considered with a row-based granularity.
Need more control?
To have more control over your generated process model for further analyses, you can define two types of filtering on your process model. However, none of them is mandatory.
Path threshold
This field sets a threshold determining how many paths among the activities in the should be considered to plot. Its format should be a percentage and within the range of 1 to 100. The default value is 80%. The threshold works on the frequency of relation between two activities based on the unique values of case identifiers (distinct count of case ID). To avoid a disconnected process model, even at the lowest amount of this threshold, main paths remain.
Activity threshold
This field sets a threshold determining how many activities should be considered to plot. Its format should be a percentage and within the range of 1 to 100. The default value is 100%. The threshold works on the frequency of activities based on the unique values of case identifiers (distinct count of case Id).
Get in touch with us
Please set the ‘Contact Form’ component shortcode